Know what changed in your business. Know why. Know what to investigate next.
ESYX watches your data, flags the changes that matter, explains the measurable factors behind them, and lets you test what to do next — one loop, in plain language.
One loop: from “something moved” to “here's what we tested”
Your business data flows in; ESYX understands it, monitors it, and explains it. You never need to know what an ETL or an RFM is.
ESYX watches your numbers and flags the movements that matter — before you go looking for them.
One click decomposes the change into its measurable contributing factors, reconciled to the paisa.
Jump straight to the products, customers or regions involved. No hunting through twelve dashboards.
Simulate a price, spend or demand change on a sandboxed copy. A projection — never a promise.
Turn the investigation into a shareable PDF: what changed, why, and what you tested.
“Revenue moved.”
ESYX shows you what moved it.
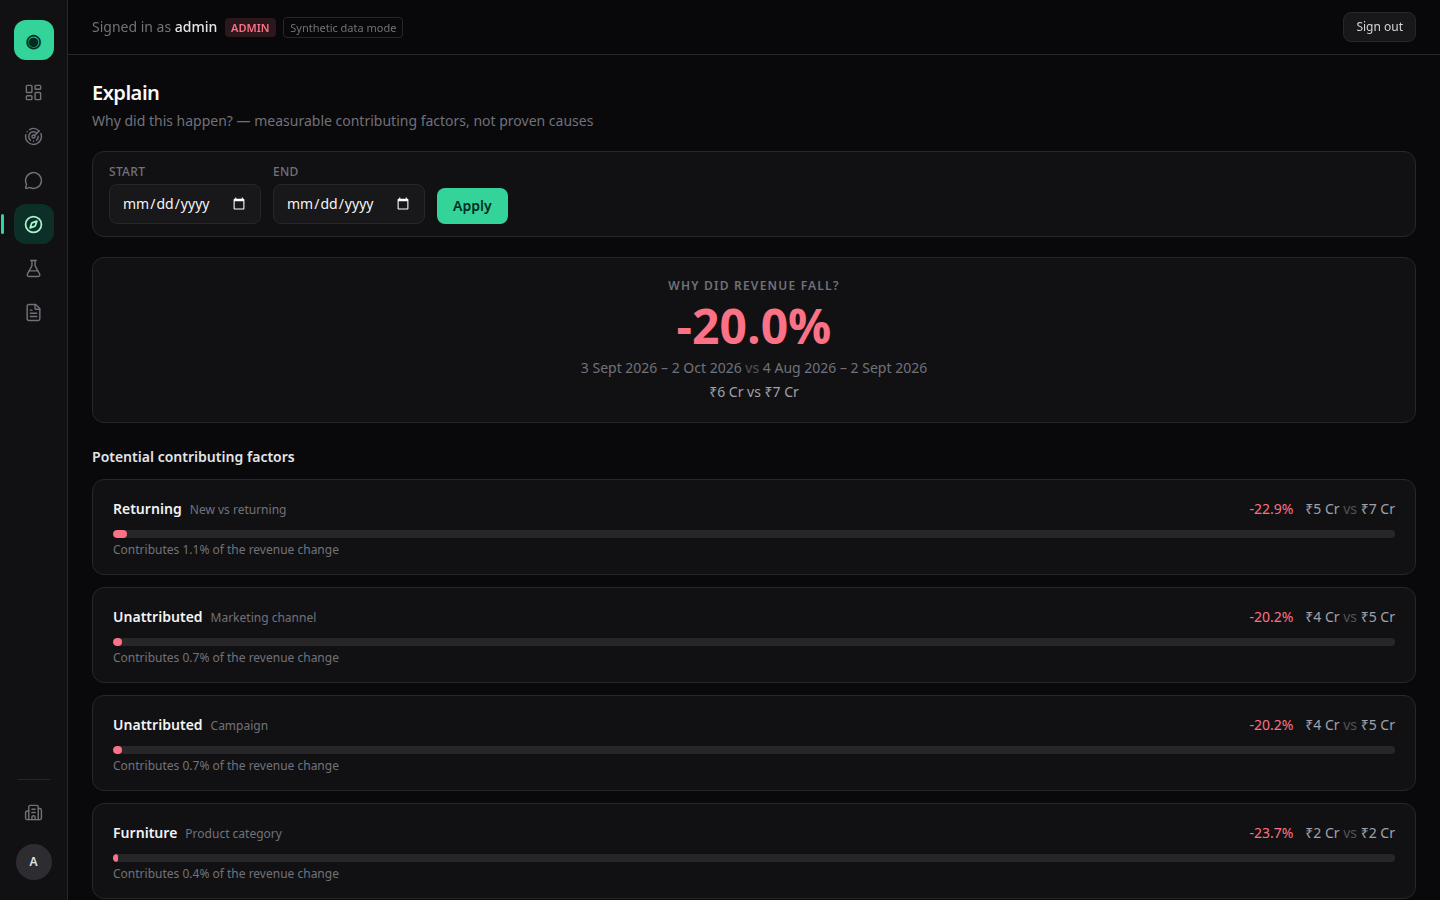
Explain decomposes any revenue or profit movement across seven dimensions and quantifies each factor's contribution — with the arithmetic reconciled to the paisa.
- ▸ Contributions that sum exactly to the total change — no hand-waving.
- ▸ Plain-language factors: “associated with”, never fake causation.
- ▸ One click from the explanation to the products, customers or regions involved.
The machinery behind the answers
Twelve working modules fed by one warehouse and one set of analytics engines — there when you want depth, out of the way when you don't.
What changed, why, and what needs attention — the first screen, in plain language.
Sales, profit, and where the money comes from — by channel, category and region.
Who buys, who spends most, and who may not come back.
What sells, what earns, and what drags.
Spend versus the revenue associated with it — CAC and ROAS underneath.
Stock that needs attention before it runs out.
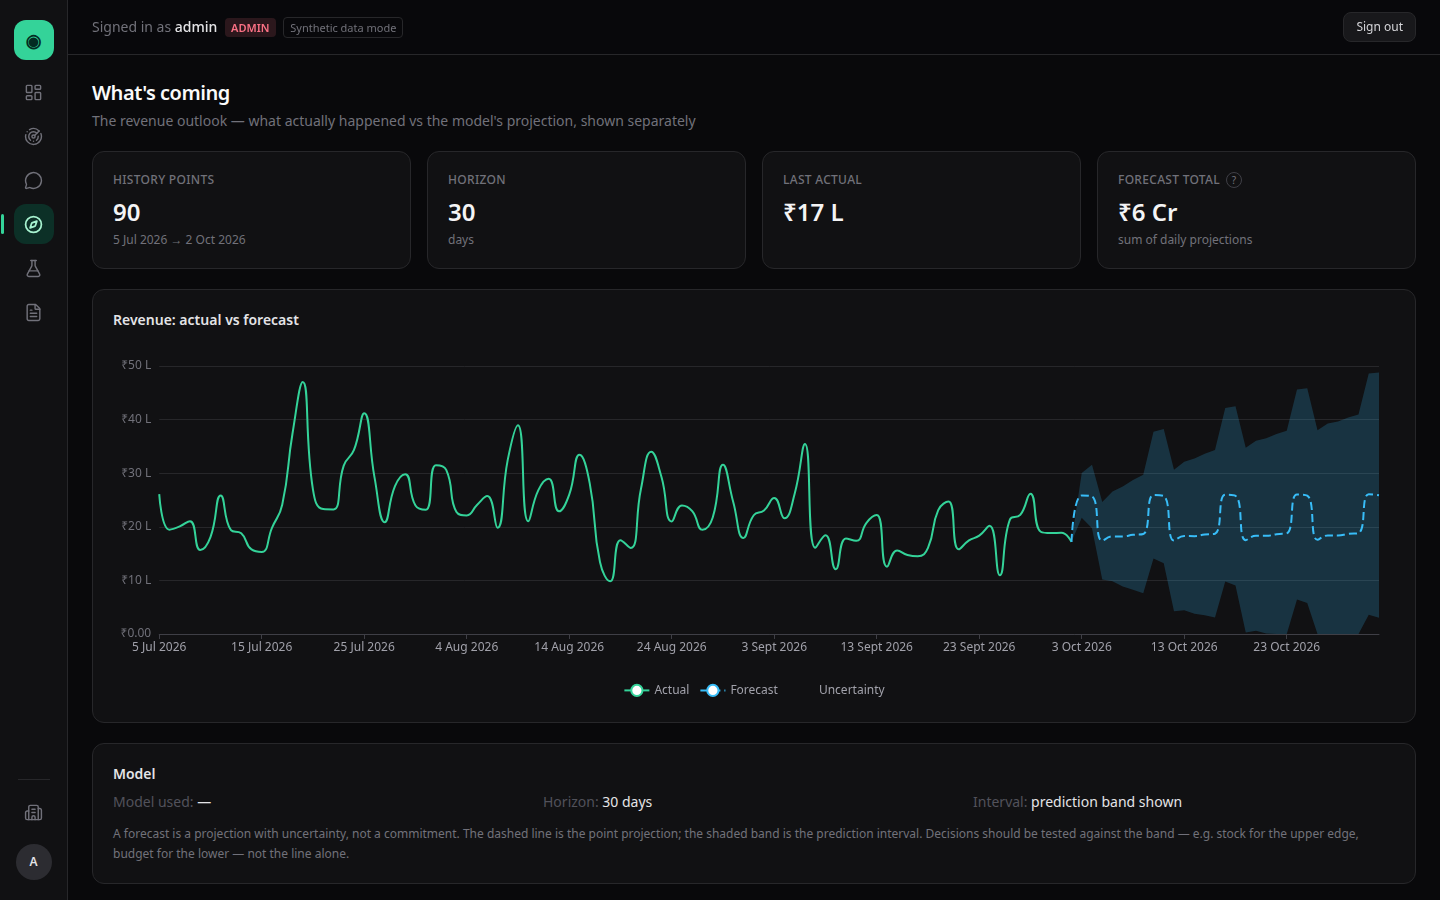
The revenue outlook, with honest accuracy scores measured on held-out data.
Unusual movements across your business, detected and flagged automatically.
Any change, decomposed into its contributing factors — with the arithmetic shown.
What-if projections on a sandboxed copy. History is never modified.
Board-ready PDF reports generated from live analytics.
Whitelist-controlled exploration of the warehouse, safely scoped.
From raw data to a decision in four steps
Source data lands in a raw zone, passes a quality gate, and anything broken is quarantined — never silently loaded.
Clean facts and dimensions in PostgreSQL, with tenant isolation enforced by row-level security.
Analytics engines plus ML: churn scoring, forecasting, anomaly detection and customer segmentation.
Every movement is decomposed into contributing factors, in plain language, with the arithmetic shown.
Built like it holds real money — because it does
Admin, analyst, manager and viewer roles, enforced on every API route.
PostgreSQL row-level security keeps every organisation's data separated in the database itself.
Signed tokens, hashed passwords, and organisation context that can never be spoofed from the client.
Parameterized queries only, secrets from environment, and a whitelist-controlled data explorer.
Questions
What is ESYX?
ESYX tells you what is happening in your business, why it is happening, and what to investigate next. It ingests company data into a PostgreSQL warehouse, runs analytics and machine-learning engines over it, and serves the results through a role-based web console built around one loop: detect a change, explain it, investigate it, simulate a response, report it.
What does Explain do?
When a metric moves, Explain decomposes the change across seven dimensions (channel, category, region, customer segment and more) and quantifies each factor's contribution, reconciled to the total. It names associated factors — it never dresses correlation up as causation.
Can Scenario simulations change my historical data?
No. Scenarios run on a sandboxed copy and are labelled as projections. The warehouse and historical records are never modified.
Is the demo data real?
No — and it never pretends to be. The public console runs on a synthetic demonstration business, generated to behave like a real company (weekend peaks, VIP customers who outspend regulars, real stockout pressure) and labelled 'Synthetic data mode' everywhere in the product.
Can I connect my own business data?
Not yet — that is the next build stage (real connectors for CSV/Excel, Shopify, PostgreSQL and REST APIs, with validation and mapping on the way in). The warehouse, quality gates and tenant isolation those connectors will feed are already built and running.
Who can see what?
Four roles — admin, analyst, manager and viewer — with permissions enforced in the API and tenant isolation enforced in the database itself via PostgreSQL row-level security.
What is ESYX built on?
PostgreSQL warehouse, FastAPI analytics/ML services (Python), Redis caching, Celery background jobs, and a Next.js console.
See your business clearly.
Sign in and ask the only question that matters: what changed?
Sign in to ESYX